


With just three games to play in the Big 12 regular season, the Texas Longhorns find themselves squarely on the bubble. Despite being ranked in the Top 10 nationally during the non-conference slate, the Longhorns have squandered numerous opportunities for quality wins, and would now need a miraculous run to reach .500 in league play. However, it seems that every year fans forget just how average the teams are that you find on the famous bubble. Texas fans can be excused for overestimating the quality of bubble competition, considering that their team has only had to sweat the bubble twice in over a decade. It’s even more understandable when you remember that, in the south, basketball is a cute distraction that fills the time between football and spring football. Still, the fact remains that every February, when it’s time for the college basketball world to finally assess the state of the bubble, the same annual conclusion is reached — it’s a soft bubble. Perhaps we can just do away with the idea of a soft bubble, and realize that it’s always mushy. There is no surface tension on the bubble, and all of the cute TV graphics saying “Poppin’ Bubbles” are misguided because the thing is always so damned squishy it could never pop. With all that in mind, perhaps it will come as less of a surprise that the Longhorns still control their own destiny when it comes to the NCAA tournament. Win two of their final three games, and they should be in the field. Furthermore, if any of the other bubble teams play like bubble teams, two out of three wins could even help the Longhorns avoid the dreaded First Four. Now, to the data. In this chart, the “Matrix” column is a ranking of the teams based on The Bracket Matrix. Due to some participants not updating their brackets as frequently, it can lag a little bit behind real-world results, but the composite can be more helpful than focusing on one or two bracketologists at the big-name sites. A team’s W-L mark includes all games, but the committe only looks at D-I results. If a team has an asterisk next to its name, that means that one of its wins came against competition not in D-I. If it has two — that’d be you, Boise State and BYU — then they have two wins against scrubs. If it has one in the “100+ Ls” column, that means that the team actually lost to a team outside of Division I. That’s not a hot look for Tulsa. The records, RPI, and SOS are updated through Thursday’s games. The KP W-L column is a team’s projected finish, as of Friday night. 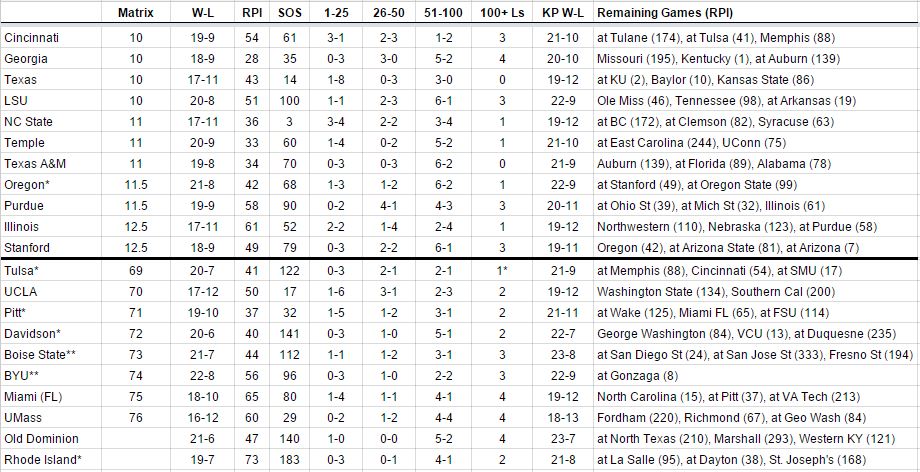 Some key stats to consider as you look at the table above and consider the road ahead for Texas: First, the highest RPI for a power-conference team left out of the tournament was 2005-06 Cincinnati, with an RPI rank of 40. That year, the Bearcats played three teams outside of Division I, so the exclusion was likely a verdict on their scheduling. Second, the committee has been kind to teams from tough conferences that miss the .500 mark by a game. In each of the last three seasons, at least one team sporting an 8-10 mark in one of that season’s toughest leagues made it into the tournament. This year, the Big 12 is the nation’s toughest league in terms of both RPI and KenPom rankings. However, you have to go all the way back to 1998 to find a team two games below .500 in conference play that made the Big Dance. If the Longhorns cannot win two of their final three to reach the 8-10 mark, they would have to log some pretty impressive victories in the conference tournament to still be in contention for bid. |